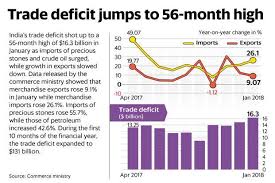
India's merchandise exports rose 3.7% to US$ 26.36 billion in January 2019 over a year ago. Meanwhile, merchandise imports was flat at US$ 41.09 billion. The trade deficit declined 6.1% to US$ 14.73 billion in January 2019 from US$ 16.30 billion in January 2018.
Oil imports declined 3.6% to US$ 11.24 billion, while the non-oil imports rose 1.4% to US$ 29.85 billion in January 2019 over January 2018. The share of oil imports in total imports was 27.4% in January 2019, compared with 28.7% in January 2018.
Among the non-oil imports, the major contributors to the overall fall in imports were pearls, precious & semi-precious stones imports declining 36.5% to US$ 1.56 billion, transport equipment 21.4% to US$ 1.82 billion, metaliferrous ores & other minerals 48.9% to US$ 0.51 billion and vegetable oil 19.9% to US$ 0.74 billion.
However, the imports have increased for gold by 38.2% to US$ 2.31 billion, electronic goods 8.0% to US$ 4.72 billion, electrical & non-electrical machinery 10.2% to US$ 3.29 billion, crude & manufactured fertilisers 68.7% to US$ 0.75 billion, iron & steel 17.6% to US$ 1.52 billion, organic & inorganic chemicals 8.2% to US$ 1.95 billion and non-ferrous metals 10.4% to US$ 1.26 billion.
The imports also improved for artificial resins, plastic materials, etc by 5.6% to US$ 1.30 billion, wood & wood products 11.7% to US$ 0.55 billion, coal, coke & briquettes, etc 2.2% to US$ 2.25 billion, medicinal & pharmaceutical products 8.8% to US$ 0.52 billion, machine tools 10.6% to US$ 0.42 billion and chemical material & products 4.0% to US$ 0.67 billion in January 2019.
On exports front, the electronic goods recorded an increase in exports by 67.0% to US$ 0.77 billion, followed by organic & inorganic chemicals 15.6% to US$ 1.86 billion, drugs & pharmaceuticals 15.2% to US$ 1.59 billion, gems & jewellery 6.7% to US$ 3.25 billion, RMG of all textiles 9.3% to US$ 1.53 billion, and plastic & linoleum 17.6% to US$ 0.72 billion.
The exports also improved for engineering goods by 1.1% to US$ 6.51 billion, ceramic products & glassware 30.3% to US$ 0.22 billion, cotton yarn/fabrics/made-ups, handloom products etc 4.9% to US$ 0.89 billion, meat, dairy & poultry products 12.2% to US$ 0.33 billion and spices 11.3% to US$ 0.25 billion in January 2019.
Further, the exports also moved up for handicrafts excluding handmade carpet by 17.0% to US$ 0.16 billion, rice 3.3% to US$ 0.72 billion, man-made yarn/fabrics/made-ups etc 4.0% to US$ 0.42 billion and leather & leather products 0.3% to US$ 0.44 billion in January 2019.
However, the exports declined for petroleum products by 19.0% to US$ 3.21 billion, marine products 8.7% to US$ 0.43 billion, fruits & vegetables 14.2% to US$ 0.20 billion, and mica, coal & other ores, minerals including processed minerals 6.1% to US$ 0.34 billion in January 2019.
Merchandise exports in rupees increased 15.3% to Rs 186453 crore, while imports moved up 11.2% to Rs 290612 crore in January 2019 over January 2018. The trade deficit rose to Rs 104159 crore in January 2019 compared with Rs 103718 crore in January 2018.
India's merchandise exports increased 9.1% to US$ 271.80 billion, while merchandise imports moved up 11.9% to US$ 427.73 billion in April-January 2019. An increase in imports was driven by a 35.8% jump in oil imports to US$ 119.34 billion. India's merchandise trade deficit rose to US$ 155.93 billion in April-January 2019 from US$ 133.82 billion in April-January 2018.
0 thoughts on “Exports rises 3 7 in January 2019”